This work is licensed under a Creative Commons Attribution

Citation
Please cite this document as:
Rathore, C.S. (2017): Using the GPS Logger Android App for Field Surveys, Tech Demonstrator Note TDN1701, Teaching Note.
1. BACKGROUND
One of the fundamental requirements in geospatial analysis is the availability of geo-referenced data. To collect geo-referenced data from field surveys you normally require a GPS receiver, which is either expensive or usually not available in required numbers. With GPS enabled smartphones becoming ubiquitous, an alternative solution is to have an app on the smartphone that can function like a GPS receiver. If this arrangement is accurate enough for the desired work, students, researchers, government organizations, natural resource and rural development managers, field health personnel and a host of other people can use it for collecting geo-referenced field data at practically no cost. In such a scenario, managers in resource starved government organizations or NGOs could train their staff to routinely gather geo-referenced data in the field and thus incorporate geo-spatial intelligence in their decision-making.
For example, field personnel can be trained to collect coordinates of nesting sites, man-animal conflict locations, plantation boundaries, pollution point sources, undocumented roads and trails, health facilities and schools in rural areas, locations of diseases outbreaks and so on. This data can then be shared using email or uploaded to build and update geo-databases.
While there are many apps that provide this capability, they usually come with one or more of the following limitations:
-
They are not free
-
Many free apps might have restrictions on the number of waypoints that can be recorded or exported.
-
They might not be sufficiently consistent in positional accuracy
-
They do not permit export at all till you upgrade to a paid version
-
Exported file formats are not directly usable in Google Earth or GIS environment.
-
They demand too many permissions creating privacy concerns
-
They show advertisements and annoying tickers for in-app purchases.
In this tech demonstrator I evaluate and provide a tutorial for a free android application called GPS Logger developed by Basic Air Data. I zeroed in on this application after some research and found that not only it is free, it does not impose any of the above mentioned limitations.
2. INSTALLING AND USING GPS LOGGER
| This section has been revised in July 2025 from the original note published in 2017 to include latest screenshots of the GPS Logger App interface a functionality. |
2.1. Installing the GPS Logger App
The GPS Logger (version 3.2.3 at the time of writing) is is available for Android smartphones. It can be downloaded and installed from the Google Playstore.
2.2. Recording and Annotating Waypoints or Placemarks
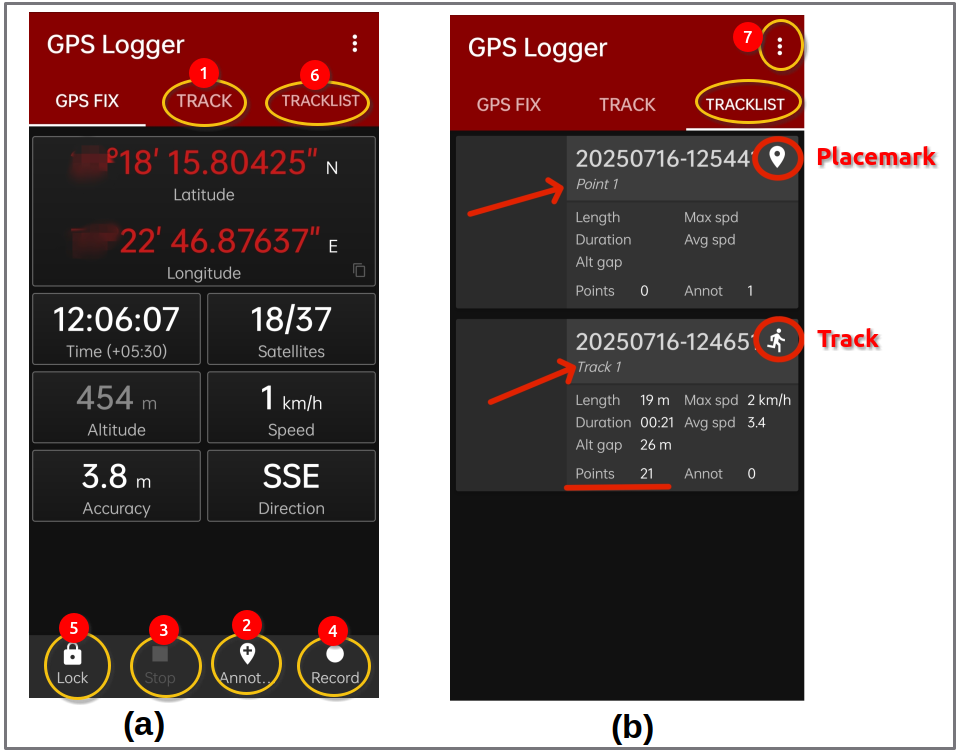
Once installed, using the app is quite easy. Move out to an open area where you have visibility of the sky, enable the smartphone GPS (location) and start the GPS Logger app. Figure 1(a) shows the opening screen of GPS Logger 3.2.3 displaying a GPX fix after a few seconds of switching ON (the first fix might however take longer so be patient!).
Once you have a stable fix and a stable estimate of accuracy, you can start collecting waypoints and tracks. Referring to Figure 1(a), to record a waypoint or a placemark, tap on the Track Tab (callout 1) and press the Add Annotation button  (callout 2) at the bottom of the screen. Give your waypoint point a name. You can then walk to another waypoint of interest and repeat the process i.e. press the Add Annotation button to record and then give the second waypoint a name. In this manner, you can collect as many waypoints as you want. Once you have done collecting your waypoints, press the Stop button (callout 3) to conclude and give this collection of waypoints a name under which these waypoints or placemarks will be saved in the tracklist.
To see the saved waypoint file, press the tracklist tab.
(callout 2) at the bottom of the screen. Give your waypoint point a name. You can then walk to another waypoint of interest and repeat the process i.e. press the Add Annotation button to record and then give the second waypoint a name. In this manner, you can collect as many waypoints as you want. Once you have done collecting your waypoints, press the Stop button (callout 3) to conclude and give this collection of waypoints a name under which these waypoints or placemarks will be saved in the tracklist.
To see the saved waypoint file, press the tracklist tab.
2.3. Recording and Annotating Tracks
To record a track, press the Record button (callout 4). Walk or drive around to complete your track and to stop recording, press the Stop button (callout 3) and save the track with a name. During the recording of a track, you can pause the recording by hitting the pause button (the record button becomes the pause button while recording) and annotate key landmarks on the track by pressing the Annotation button and giving that landmark a name. You can resume recording the track by hitting the record button again. When you are recording a track, you can, if you wish, press the lock button  which prevents accidental pressing of the stop or pause buttons while recording. When the lock button is engaged, no buttons on the bottom bar work.
2.4. Viewing and Exporting the Tracklist
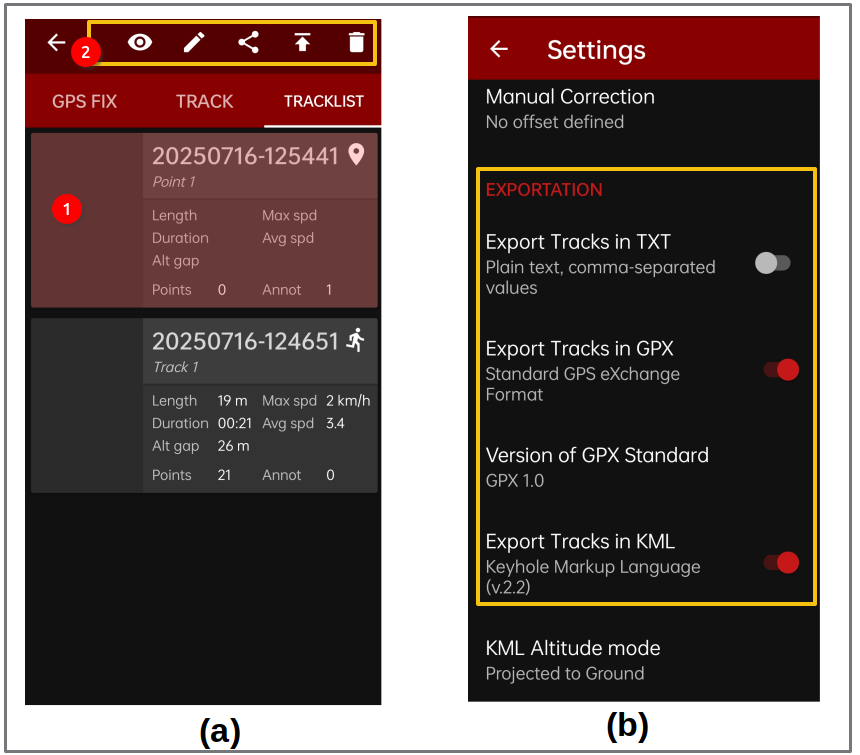
Press the Tracklist tab (callout 6) on top right of the screen to see all your saved waypoints and tracks, indicated by different icons (Figure 1(b). Notice in Figure 1(b) that the track icon indicates that track was completed on foot (walking figure).You can change these icons via the edit. Tapping on any item listed (Figure 2(a) — callout 1) in the tracklist opens up options to view  , edit
  , share
 ![]() , export
, export  or delete (Figure 2(a) — callout 2). Try seeing a saved placemark or track on Google Earth if installed using the icon. Try exporting one as a KML or GPX file by tapping on the export icon. Tap the three dots to access export settings (Figure 2(a) — callout 7) from where you can choose export formats as seen in (Figure 2(b). To know more about using the app, view the tutorial videos mentioned below or refer to the getting GPS Logger get started guide.
These waypoints and tracks can be exported in GPX, KML and text or Comma Separated Values (CSV) formats. There is absolutely no limitation on the number of waypoints or tracks that can be recorded or exported.
In summary,the app is very easy to use, doesn’t track you and does not share any data with any third party. It starts almost immediately even on low end smartphones and has a remarkably clean interface that focuses on the essentials.
|
Tutorial Videos on GPS Logger App
I have created the following video tutorial on how to use the GPS Logger App which will provide the reader with a quick head start in using this app for field surveys. This is a 2025 update of the following older video of GPS Logger that I had created 8 years ago. The following older video is still relevant and instructive. |
As is the case with most smartphones which have assisted GPS, you can get a much faster fix if prior to moving out in the field, you enable your smartphone GPS when you have internet access and get a position fix. This quickly updates the almanac information (which remains useable for a few months) via the internet and is particularly time saving if you haven’t used positioning applications for a long time or have moved to a new location a few hundred kilometers away from where you last used your smartphone GPS. Fundamentally, however, the GPS logger app does not need Internet connectivity and can work without any data assistance in the field.
3. HOW DOES IT COMPARE TO A GPS RECEIVER?
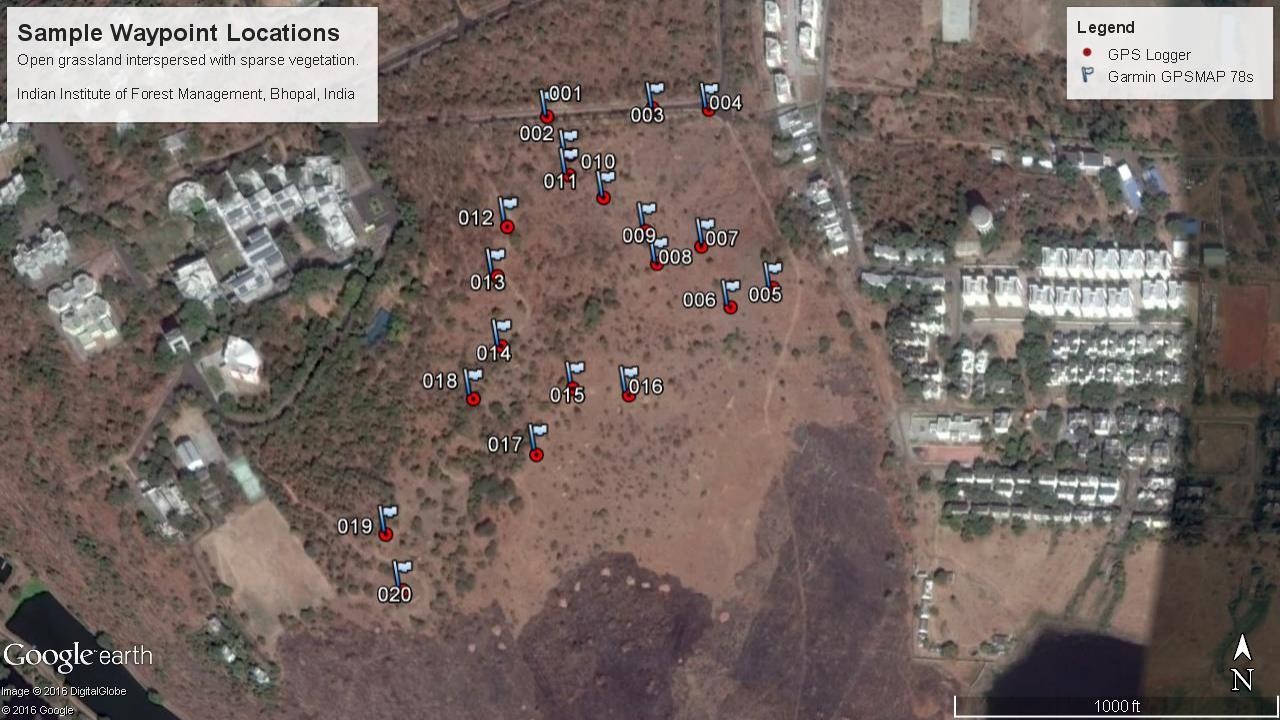
To test how the GPS Logger app compared with a recreation grade GPS receiver, I did a quick and dirty experiment collecting 20 sample waypoints in an open area (grassland interspersed with sparse trees) in the campus of the Indian Institute of Forest Management, Bhopal, India.
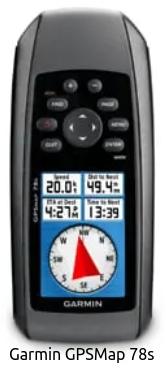
For this experiment, I used the GPS logger app installed on a slightly older smartphone (running Android 4.1.2, 1 GB RAM, no e-compass) which could view only the GPS constellation (no GLONASS or BIEDOU). As reference, the GARMIN GPSMAP 78s GPS receiver — WGS 84, without WAAS ([fig-gpsmap]) was used.
At each of the 20 location, the latitude, longitude and altitude was recorded with both GPS logger app and the Garmin GPS Receiver and the Root Mean Squared Error (RMSE) was calculated. Figure 3 shows these points on Google Earth. The collection of 20 points and the method of calculation of horizontal and vertical accuracy was as per guidelines specified by the US Federal Geographic Data Committee (FGDC,1998; LMIC,1999). Coordinates collected from both GPS Logger and Garmin GPSMAP 78s were converted to UTM meters using tools available at the earthpoint.
3.1. HORIZONTAL ACCURACY
Table shown in Figure 4 presents the horizontal accuracy estimates between Garmin GPS receiver (reference value) and the GPS Logger App (test value). The RMSE for the 20 sample points was computed to be 1.63 meters and the US National Standard for Spatial Data Accuracy Statistic (NSSDA - 95% confidence level) was computed to be 2.82 meters.
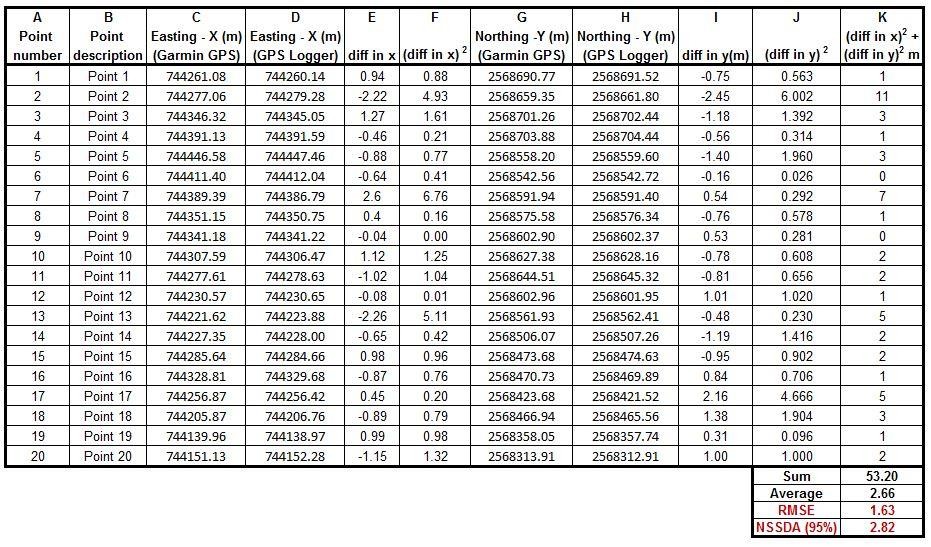
What the above results indicate in summary is that 19 out of 20 points collected using the GPS logger are likely to fall within about 3 meters in terms of horizontal accuracy from the readings collected using the recreation grade GPS receiver used in this experiment. Only 1 point out of the 20 points is likely to fall farther than 3 meters from the location reported by the recreation grade GPS receiver used in the study.
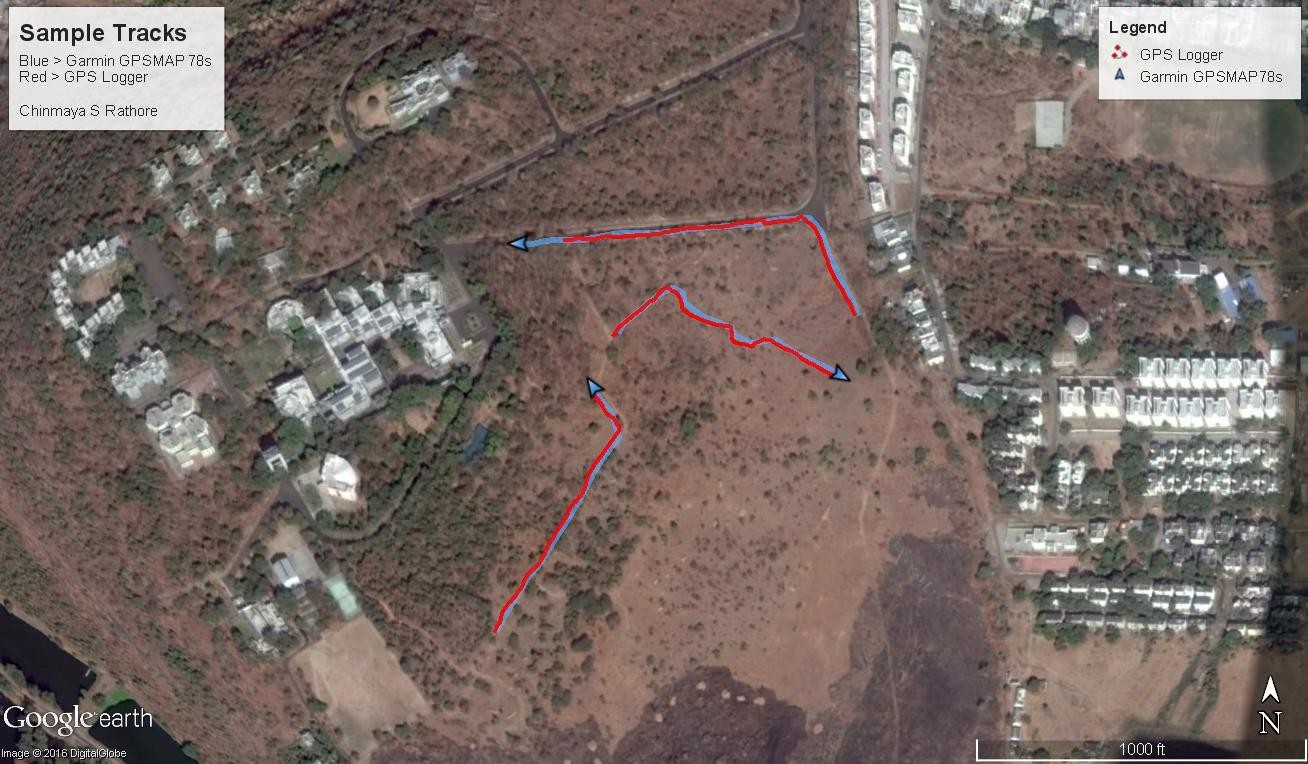
Three tracks in the same area were also collected using both Garmin GPSMAP 78s (blue line) and the GPS Logger App (red line) to assess visual correspondence (Figure 5). As can be seen, the tracks from both sources, by and large, match up pretty good with occasional divergence of 3-5 meters at certain places.
3.2. VERTICAL ACCURACY
With reference to comparison of vertical issue between the Garmin GPSMAP 78s and the GPS Logger, it is instructive that we first dwell into a brief discussion on vertical datums. While this discussion might appear theoretically knotty for some, it is necessary to understand what the GPS Logger app is doing. From a broad working perspective, the concept of vertical datum and heights can be conceptualized with the help of Figure 6. The Mean Sea Level or MSL is defined as the zero elevation for a local or regional area (NGA, 2014) and elevations are commonly represented above the MSL. The GPS models the earth as an ellipsoid, which is a geometrical approximation of the size & shape of the earth. However, the earth while resembling an ellipsoid (squished at poles and bulging at the equator), is however not uniform and has mountains and trenches popping above or going below the uniform ellipsoidal surface (labelled topography in Figure 6). When a GPS receiver reports elevation at any point on the earth’s topography, it is usually the height from the surface of the ellipsoid to that point – denoted by h and called ellipsoidal height. The surface of the ellipsoid is not the Mean Sea Level (MSL). The Geoid instead, technically referred to as an equipotential surface defined by earth’s gravity, approximates closely the Mean Sea Level. The geoid in simple terms creates a mathematical model for the entire globe virtually extending the coastline (MSL) inland using gravity values. Witold (2003) and NGA (2014) provide an excellent explanation of the geoid concept in the following words:
“It turns out that MSL is a close approximation to another surface, defined by gravity, called the geoid, which is the true zero surface for measuring elevations. Because we cannot directly see the geoid surface, we cannot actually measure the heights above or below the geoid surface. We must infer where this surface is by making gravity measurements and by modeling it mathematically. For practical purposes, we assume that at the coastline the geoid and the MSL surfaces are essentially the same.” NGA (2014)
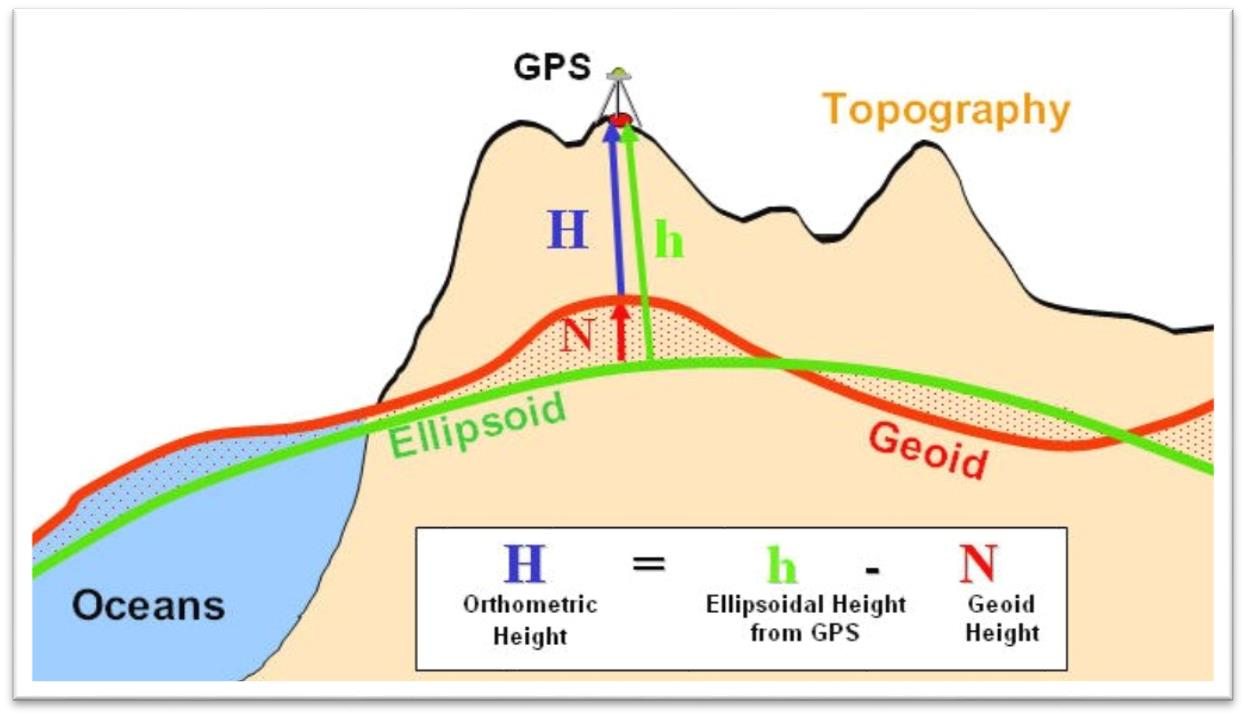
Image Credit Oklahoma University
So referring back to Figure 6, if we want to report the height above the Mean Sea Level or MSL i.e. H also known as orthometric height, we need to calculate N – the geoid height or the difference between the geoid and ellipsoid at a given coordinate on the surface of earth and subtract it from the ellipsoidal height.
The geoid height at any coordinate can be calculated using geoid models like EGM96 (Earth Gravitational Model 1996) which has been developed by the US National Imagery and Mapping Agency (NIMA), the NASA Goddard Space Flight Center (GSFC), and the Ohio State University. A good explanation of the geoid and MSL is available at this NOAA website.
With the above background, let us try to breakdown how the GPS Logger calculates orthometric height from ellipsoidal height after the EGM96 correction is enabled (Figure 7).
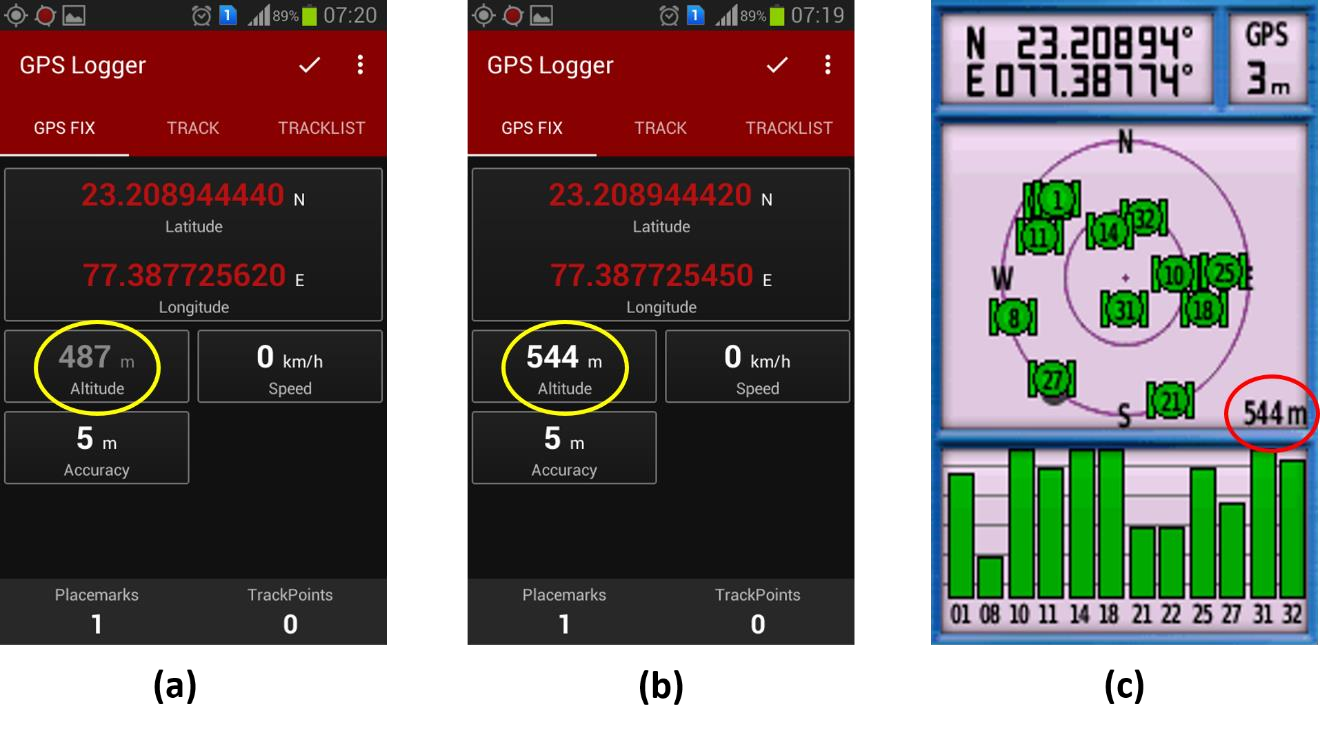
Figure 7 a shows the GPS Logger altitude value before EGM96 correction i.e. ellipsoidal height, Figure 7b shows GPS Logger altitude value with EGM96 correction switched on i.e. Orthometric height and Figure 7c, Garmin GPSMAP 78s altitude value at the same spot. Notice prior to the EGM96 correction, the GPS Logger altitude value is 487 meters and with the correction, it is 544 meters – a difference of 57 meters!
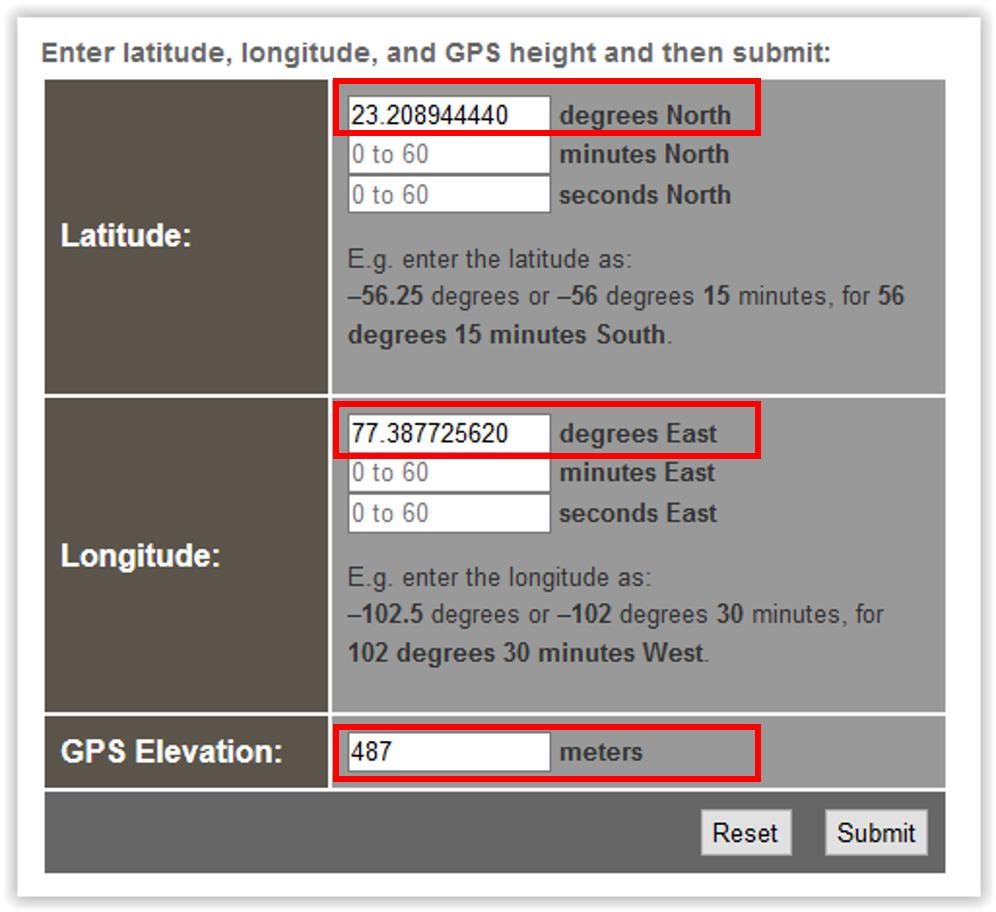
How did the GPS Logger arrive at 544 meters? For the purpose of illustration, I independently tested this correction using an online Geoid Calculator sponsored by NASA and US National Science Foundation. Figure 8 shows this calculation for coordinates and elevation (487 m) given in Figure 7a. Figure 9 shows the computed results. Figure 10 shows geoid height calculation for the same coordinates (IIFM Bhopal campus) using another EGM96 geoid calculator at the NGA site.
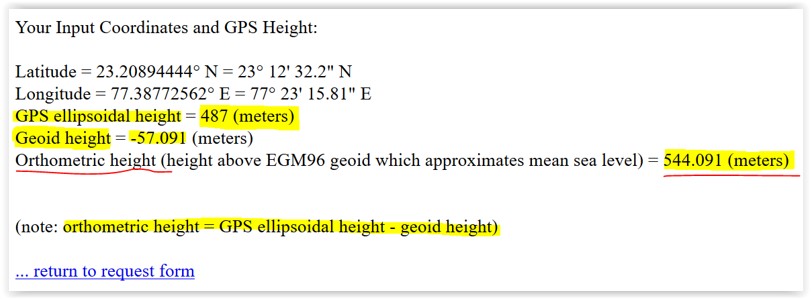
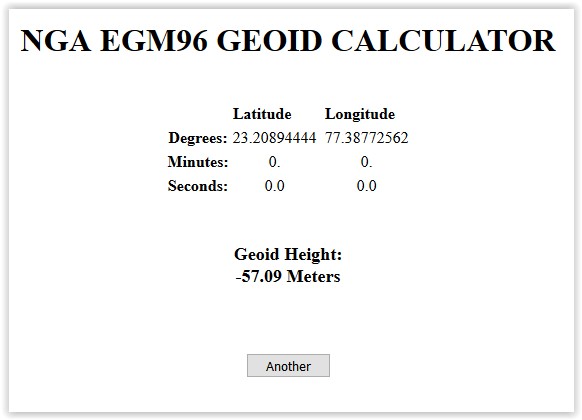
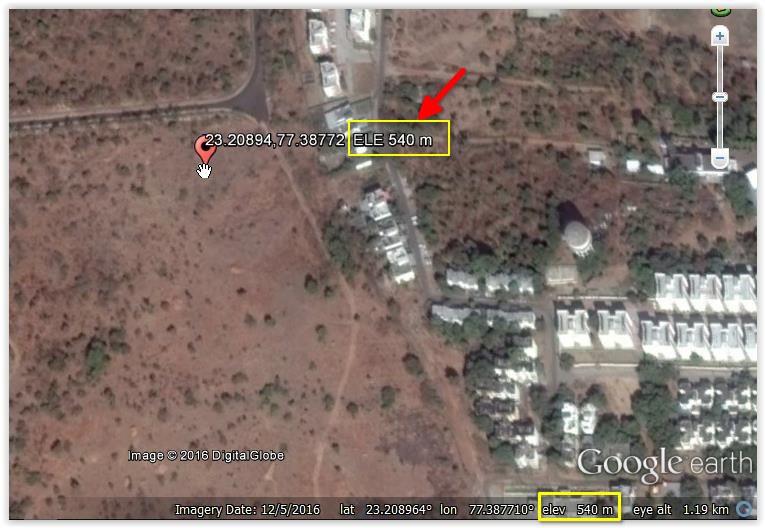
The geoid height computed by the UNAVCO tool is the same as the geoid height shown by the NGA (US Military EGM tool). As can be inferred from figures Figure 7b & Figure 9, that the orthometric height calculated by the UNAVCO tool is identical to the orthometric height calculated by the GPS Logger app. As is evident, the EGM96 geoid height for this coordinate is -57.091 meters, ellipsoidal height is 487 meters and so the orthometric height is 487 – (-57.091) = 544.091 or 544 meters as calculated by GPS Logger. This matches exactly with the elevation shown by the Garmin GPSMAP 78s (Figure 7c) and very close to the Google Earth elevation (MSL) at the same location as shown in Figure 11.
This discussion on altitude is important for another reason. When we try to compare orthometric height given by GPS Logger (Figure 6b), we can compare it only with orthometric height from the GPS receiver and not the ellipsoidal height. Many GPS receivers however display ellipsoidal height rather than the orthometric height. However, in recent times, major GPS receiver manufacturers, after determining the default WGS84 ellipsoidal height, correct the same performing behind-the scenes calculations using geoid models and then finally displaying orthometric heights. As this experiment was primarily aimed at understanding how the GPS Logger android app performs in comparison to a recreation grade receiver, in terms of altitude comparison, it was important to know if the Garmin GPSMAP 78s was indeed reporting orthometric heights as figure 6b and 6c seem to suggest. The user manual of the GPSMAP 78s did not categorically mention anything on this in particular and searches on the Garmin website were not useful even though the glossary of terms at the Garmin website refers to elevation as distance above or below mean sea level The author contacted Garmin for clarity on the above but could not get a response until the writing of this document.
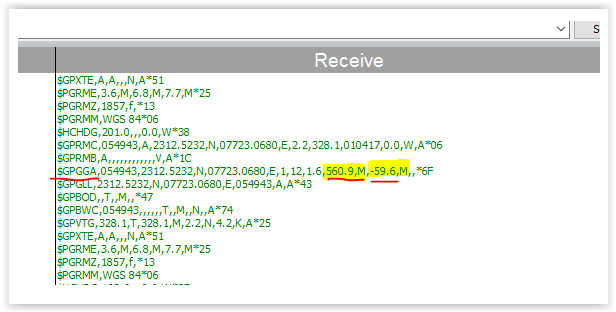
To find out if the Garmin receiver was indeed computing and using geoid height, raw NMEA sentences were captured from the Garmin GPSMAP 78s through the com port and it was observed that the $CPGGA sentence (the sentence containing the GPS fix data) was indeed calculating the geoid height and therefore reporting orthometric height or height at MSL. Figure 12 shows a sample waypoint capture of the NMEA sentence stream. The highlights show the altitude for a waypoint in meters above mean sea level as 560.9 m and the height of the geoid (mean sea level) above WGS84 as -59.6 m as per NMEA $CPGGA sentence specifications.
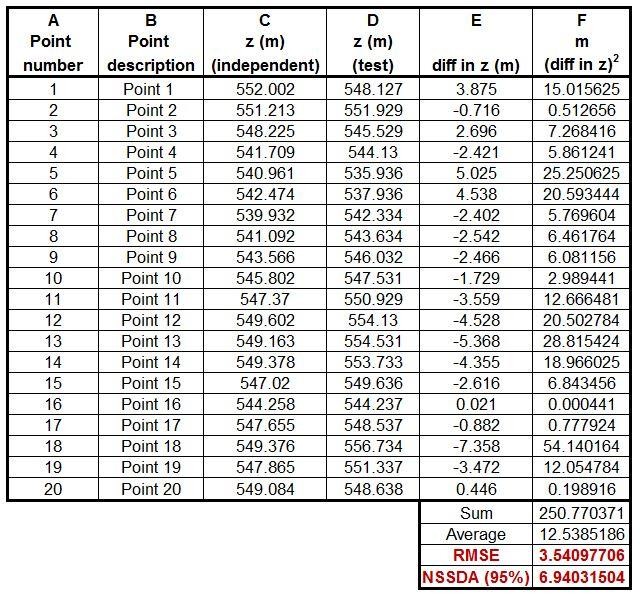
The table shown in Figure 13 presents the elevation accuracy figures between the GPS Logger with the (altitude correction — EGM96 Correction — switched ON) and the Garmin GPSMap 78s. The RMSE was computed to be 3.54 meters and NSSDA Statistic (95% confidence level) to be 6.94 meters. The mean elevation difference (Column E) was -1.39 meters (absolute value 1.39 meters).
It must be mentioned here that very accurate height measurements (other than that obtained from GPS) of the 20 random points that were tested were not available. This was also not felt necessary as the objective here was primarily to compare the performance of the GPS Logger app with a standard recreational grade GPS receiver (rather than make an absolute assessment of which device was more accurate).
In summary, height measurements reported by GPS Logger, after the EGM96 correction was enabled, were usually quite comparable to those reported by the GARMIN GPS 78s provided there was no major obstruction of the sky.
3.3. SUMMARIZING RESULTS
These preliminary results seem to suggest that the GPS logger performed quite well and can be used like a recreational grade GPS receiver to collect georeferenced data for many applications that do not require highly precise positioning accuracy. The orthometric height from the GPS logger showed a mean elevation variation of 1.39 meters (compared to Garmin GPSMAP 78s) after switching on the altitude correction model option (EGM96 Correction available from settings). At some points however, the altitude was off by 5-8 meters when compared to the altitude reading at the same location from the Garmin GPSMAP 78s. Given the altitude NSSDA statistic, altitude readings reported by GPS Logger after switching ON the altitude correction model might be useful for many applications. However, careful assessment is advised to evaluate acceptability of altitude accuracy for applications under consideration. It is recommended that users can consider keeping the EGM96 correction option ON to directly get orthometric heights.
I would also like to mention that after enabling your smartphone GPS and the GPS logger app, it is advisable to maintain a stationary position for about 4-5 minutes for the signal to stabilize before proceeding to collect waypoints and tracks. In fact, it might be quite desirable to do a small mock exercise with a few sample waypoints giving the app time to stabilize the fix and the user to get used to the app in field conditions before starting the actual survey.
It is worthwhile to caution however that it will be prudent to treat the above-mentioned comparative estimates of horizontal and vertical accuracy as indicative rather than conclusive and try out the app in an exploratory exercise (and preview results on Google Earth if possible) to see if it meets accuracy criteria for a particular study. It is also important to be mindful that accuracy might vary in other terrain configurations like denser vegetation etc. or in situations where there is obstruction in the line of sight.
4. APP PERFORMANCE
It was found that the GPS logger app was very reliable even while running on a low-end smartphone with limited RAM (I GB). In our use of this app over a few months’ period, the app has performed very reliably and never crashed (not even once!). Both waypoints and tracks could be recorded with ease. Exporting tracks and waypoints was accomplished without flaw and the exported files were successfully imported in Google Earth, QGIS (KML and GPX) and ArcGIS 10.5 (KML and GIS) without a glitch. In our assessment, the app is quite battery friendly and does not cause any abnormal drain of power (beyond a fair expectation with GPS and display ON) even after continuous use.
The provision of a setting that prevents the mobile phone screen to sleep is very handy. The clean and uncluttered screen design is very helpful in the field.
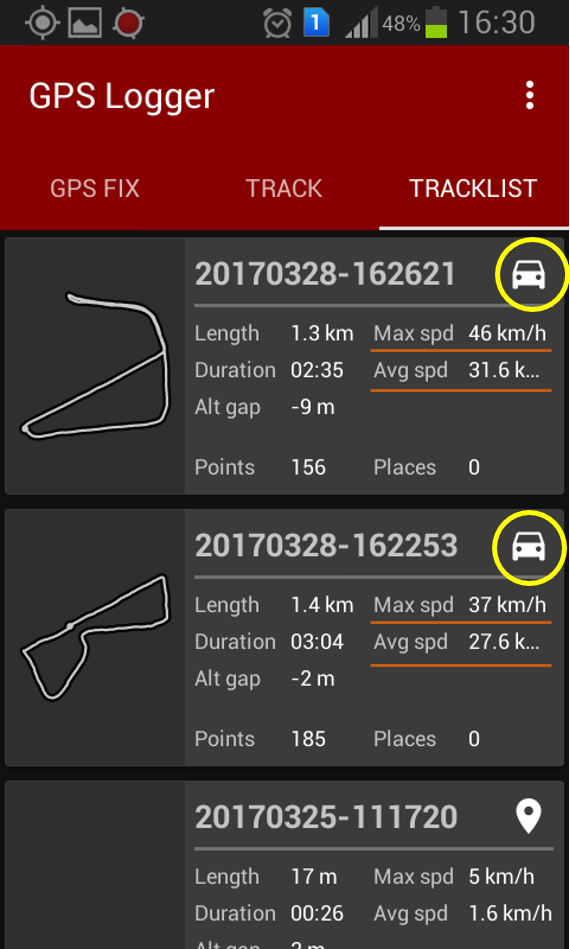
Collection of tracks while driving was done consistently at varying speeds (Figure 14). Notice that the track icon in Figure 14 automatically changes to a vehicle (encircled in yellow) as opposed to a walking figure icon (Figure 1b) when tracks are recorded while driving rather than walking. Notice the change in max and average speeds between Figure 1b and Figure 14 (orange lines) which permit the app to determine the likely mode of track acquisition. For better accuracy while recording tracks by driving, it is advised to have an overall strategy and adjust driving speed (may be slow down on bends etc.) to match GPS track data collection time interval.
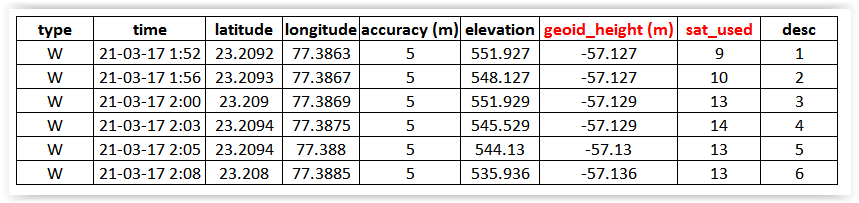
If you open the exported CSV file (table shown in Figure 14), you can also get some additional information like number of satellites used when a waypoint or track were recorded, height of the geoid if altitude correction option was switched on (for description of altitude correction model employed http://www.basicairdata.eu/projects/android/android-gps-logger/see this link)] and some other useful bits.
5. CONCLUSION
Overall, the GPS Logger free android app performed really well in our experimental field trial and compared quite well with the recreational grade GPS receiver – the Garmin GPSMAP 78s. The horizontal accuracy achieved by the app when compared to a recreational grade GPS receiver should be quite acceptable for many natural resource applications including ground truth assessment of classified satellite images from many remote sensing satellites (like Landsat TM, ETM, OLI - 30m multi-spectral spatial resolution, Indian Remote Sensing Satellite LISS III - 23.5m multispectral spatial resolution etc.). The mean altitude difference between the Garmin GPSMAP 78s and GPS Logger (with altitude correction ON) for the 20 sample points was 1.39 meters while the NSSDA statistic (95% confidence level) was about 7 meters.
The EGM96 correction option in the GPS Logger is a remarkable feature and it adds a significant amount of transparency in altitude calculations providing users with orthometric height (direct display with EGM switched ON), WGS84 ellipsoidal height (with EGM96 correction switched OFF or calculation) and the geoid height. Elevation data from GPS logger can be used for many NRM applications after due consideration of implications of the extent of elevation inaccuracies as reported in this document. Given the fact that smartphones with GPS capabilities are common these days, the GPS logger app can help field staff routinely collect geocoded data which can then be collated and analyzed in the GIS environment.
In conclusion, it is important to state that the GPS Logger accuracy results reported in this tech demonstrator should be used more in an indicative sense and the reader should try out the GPS Logger app (preferably in their outdoor study area) to assess its suitability for a desired application ahead of planning detailed field surveys. This trial was limited to an open area with clear visibility of the sky and it is possible that horizontal and vertical accuracies might vary under different terrain or cover configurations.
The main idea behind this tech demonstrator was to introduce the GPS Logger app such that people in need of collecting geo-referenced data can try out this app to see if it meets their needs. While the GPS Logger might not completely replace the GPS receiver in all situations and advanced capabilities, it is a very promising free alternative to collect basic geo-referenced data for many NRM and other applications.
6. ACKNOWLEDGEMENTS
I would like to thank BasicAirData for developing and sharing this wonderful application. I hope that they will continue to enhance and support this app in the future.Thanks are also due to Bill Clark of Earth Point for generously sharing Earth Point resources with the academic community.
7. REFERENCES
Witold, F.(2003). Mean Sea Level, GPS, and the Geoid Special, ESRI Arc User,Summer 2003 from https://www.esri.com/about/newsroom/arcuser/mean-sea-level-gps-geoid
FDGC. (1998). Geospatial Positioning Accuracy Standards Part 3:_National Standard for Spatial Data Accuracy. Federal Geographic Data Committee. Retrieved March 27, 2017, from https://www.fgdc.gov/standards/projects/FGDC-standards-projects/accuracy/part3/index_html
LMIC. (1999). Positional Accuracy Handbook. Minnesota Land Management Information Center (LMIC). Retrieved March 26,2017, from https://www.mngeo.state.mn.us/committee/standards/positional_accuracy/positional_accuracy_handbook_nssda.pdf
NGA. (2014). Vertical Datums,Elevations and Heights. from National Geospatial-Intelligence Agency: https://earth-info.nga.mil/GandG/publications/vertdatum.html (Seen 25, March 2017)